TAgg2D.Curve(x1, y1, x2, y2, x3, y3)
Description
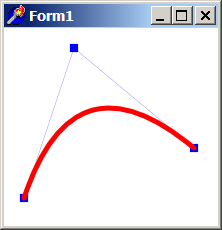
Draws quadratic (conic) Bézier curve at defined coordinates.
A quadratic Bézier segment is defined by three control points (x1, y1), (x2, y2) and (x3, y3). The curve starts at (x1, y1) and ends at (x3, y3). The shape of the curve is influenced by the placement of the internal control point (x2, y2), but the curve does not usually pass through that point. Assuming non-coincident control points, the tangent of the curve at the initial point x1 is aligned with and has the same direction as the vector x2 — x1 and the tangent at the final point x3 is aligned with and has the same direction as the vector x3 – x2.
Parameters
x1: double
X coordinate of starting control point [in subpixels].
y1: double
Y coordinate of starting control point [in subpixels].
x2: double
X coordinate of internal control point [in subpixels].
y2: double
Y coordinate of internal control point [in subpixels].
x3: double
X coordinate of ending control point [in subpixels].
y3: double
Y coordinate of ending control point [in subpixels].
Example
if VG.Attach(Image1.Picture.Bitmap) then begin

  VG.ClearAll(255, 255, 255);

  // Indicate Path for Curve
  VG.LineColor($00, $00, $FF);
  VG.FillColor($00, $00, $FF);
  VG.LineWidth(0.2);

  VG.Rectangle(20 - 4, 170 - 4, 20 + 4, 170 + 4);
  VG.Rectangle(70 - 4, 20 - 4, 70 + 4, 20 + 4);
  VG.Rectangle(190 - 4, 120 - 4, 190 + 4, 120 + 4);

  VG.Line(20, 170, 70, 20);
  VG.Line(70, 20, 190, 120);

  // Draw Quadratic (Conic) Bézier curve itself
  VG.LineColor($FF, $00, $00);
  VG.FillColor($FF, $FF, $00);
  VG.LineWidth(5);

  VG.Curve(20, 170, 70, 20, 190, 120);

end;